Weather for the weekend
In case you wonder why I am so fixated on rain, here is an image of Whiskers Creek this morning.
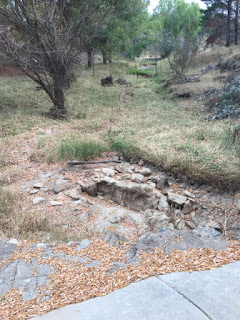 The leaves are off some willows growing along the Creek. In a normal year they'd shed their leaves in late March. Drought stress is getting them off now, as happened last year.
A post on a weather related site of which I am a member showed that we were on the cusp of some serious rainfall next Sunday. This has led me to snuffle around various forecasts to see what they say. My first call was to Wunderground which had zip for Carwoola on Saturday and 7.8mm on Sunday.
I then went to BoM which as the 'headline forecast' for Canberra had 2-8mm on Saturday and 1-5mm on Sunday. I then went to the BoM rainfall forecast for Southern Tablelands which showed the Carwoola area as no rain Saturday and then this....

....for Sunday. Very similar to the pattern in Andrew's post. We - almost directly below the 'a' at the end of Canberra - appear to be on the boundary between the 15+ and 25+ ranges - a lot more than the forecast in the headline!
Weatherzone has 10-20mm on Saturday and 1-5mm on Sunday! Time and Date offer 0 Saturday and 13.2mm on Sunday, TWC doesn't offer amounts.
Pick a number.
By Saturday morning the headline BoM forecast was 1-4 Saturday and 10-25 Sunday: presumably mainly overnight. There were lenticular clouds over the airport.
 By Sunday morning the 0445 headline forecast for Sunday was 20-45mm but the radar seemed to show the thin belt of rain heading off to the East. Things change and by 0826 the Weatherzone radar looked like offering some more!

 .. and the BoM radar at 0945.
 By 1024 we were up to 25.2mm for the day (of which 2.8mm came midnight to 6am). Having heard from my weather chat group of some extraordinary readings for Canberra - 50+mm in North Canberra - (backed up by the Canberra Times) I went to check the Nylex and it agreed with the Davis. However 25mm was enough to get the Creek running - cf the 1st photo in this post, taken from more or less the same spot.
 Indeed it was more than running: it was just beginning to go over the drive which makes it officially a flood.
 Here is the Creek on Monday 26th. Back to 'normal', although as both pipes were flowing I'd rate it as heavy flow.
 I compiled a brief report on how this event fitted in to history for the Stoney Creek Gazette. Here it is.

It is difficult to put these numbers into a clear longer term context. It is at least interesting that of the 23 heaviest February falls (arbitrarily defined as falls >20mm in a day) since 1993 over half have occurred since 2010. There were 3 heavy falls in February of that year, a further 3 in 2011, 4 In February 2012 and 3 more in February 2014.
It has been said that the pattern of rainfall in the Canberra area is changing. In the past frontal systems came through from the West giving steady rain. More recentlywe have got more localised thunderstorms with downpours. The increased incidence of falls >20mm per day might lend some support to that idea.
My summary is that the falls on the last weekend were very welcome and quite high for February in the Carwoola area. However I can’t find any underlying drama in the data.

A post on a weather related site of which I am a member showed that we were on the cusp of some serious rainfall next Sunday. This has led me to snuffle around various forecasts to see what they say. My first call was to Wunderground which had zip for Carwoola on Saturday and 7.8mm on Sunday.
I then went to BoM which as the 'headline forecast' for Canberra had 2-8mm on Saturday and 1-5mm on Sunday. I then went to the BoM rainfall forecast for Southern Tablelands which showed the Carwoola area as no rain Saturday and then this....
....for Sunday. Very similar to the pattern in Andrew's post. We - almost directly below the 'a' at the end of Canberra - appear to be on the boundary between the 15+ and 25+ ranges - a lot more than the forecast in the headline!
Weatherzone has 10-20mm on Saturday and 1-5mm on Sunday! Time and Date offer 0 Saturday and 13.2mm on Sunday, TWC doesn't offer amounts.
Pick a number.
By Saturday morning the headline BoM forecast was 1-4 Saturday and 10-25 Sunday: presumably mainly overnight. There were lenticular clouds over the airport.


And indeed some more has come. Here is WZ radar on hour later ...


Carwoola Rainfall in February
In the 48 hours to 10am on 26 February Sullivans Creek in North Canberra recorded 165mm of rain, mainly in a brief period in the morning of the 25th. This has been described as a ‘once in a 100 years event’. My weather station recorded 50.2mm over the period. To avoid issues with technology this was confirmed by checking my plastic Nylex gauge. The fall recorded in each hour is shown in the chart to the left. The total fall on the 25th was 38mm: this is the 13th highest daily fall recorded in February (and the 38th highest over all months) since 1993.
The maximum rate of rain recorded was 68.2mm per hour at
10:00am on the 25th. That is
the 45th heaviest rate (out of 1850 hours with some rainfall) since
November 2013 (when my readings begin.)
While not a centennial event both the accumulation and rate
were clearly quite high in terms of Carwoola experience.
It is difficult to put these numbers into a clear longer term context. It is at least interesting that of the 23 heaviest February falls (arbitrarily defined as falls >20mm in a day) since 1993 over half have occurred since 2010. There were 3 heavy falls in February of that year, a further 3 in 2011, 4 In February 2012 and 3 more in February 2014.
It has been said that the pattern of rainfall in the Canberra area is changing. In the past frontal systems came through from the West giving steady rain. More recentlywe have got more localised thunderstorms with downpours. The increased incidence of falls >20mm per day might lend some support to that idea.
To attempt to test that idea I have looked at the average
rainfall per day in Februarys and the Standard Deviation (SD) of the values
around that average. The SD can then be
expressed as a percentage (RSD) of the average.
That is plotted in the following graph.
This doesn’t support the notion of increasing variability: the value of r2 for the trend (0.067) shows the trend is definitely not different to 0!

This doesn’t support the notion of increasing variability: the value of r2 for the trend (0.067) shows the trend is definitely not different to 0!
I have also looked at the percentage of daily falls in
February which are greater than 5mm –
which value was chosen as a meteorologist, and keen gardener, had said that was
what was needed to do more than lay the surface dust. Again, there is no significant trend .
My summary is that the falls on the last weekend were very welcome and quite high for February in the Carwoola area. However I can’t find any underlying drama in the data.


Comments