Learning from the census
I was reviewing the topics I have covered in articles for the Gazette and found that I hadn't done anything about Education and Qualifications per se. So here goes.
The first person to learn something through this was the author who had to find out what was involved in the various Certificates etc mentioned in the Census Qualification descriptors. The authority on this seems to be the Australian Qualifications Framework. They become important when looking at the Highest Educational Attainment which will come a little further down this post.
I will however start with the topic of attendance at an educational establishment.
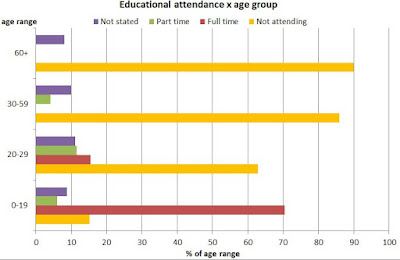 This chart shows that the information is very much in line with expectations. (So not much learning there, but it gives some confidence in the process that this is so!) A few points of interest arise:

The first person to learn something through this was the author who had to find out what was involved in the various Certificates etc mentioned in the Census Qualification descriptors. The authority on this seems to be the Australian Qualifications Framework. They become important when looking at the Highest Educational Attainment which will come a little further down this post.
I will however start with the topic of attendance at an educational establishment.

- The not-stated rate is relatively high but:
- will include all the imputed records (~7% of person records in the Gazette area);
- If people aren't attending education they may think the topic doesn't apply to them;
- They may choose not to respond if they don't attend as they might think this makes them look dumb;
- The relatively high proportion of 0-19 year olds not attending is explained by those under 5 years of age together with a proportion of the 18-19 year olds who have finished school but are not currently studying.
My next step was to look at the type of institution being attended. I started with schools which in this area at least are restricted to those under 20 Years of age. In each case the chart shows the proportion of children of the age group. There are 141 kiddies in the 0-9 Age Group and 199 kiddies (?😈?) between 10 and 19 years of age.

Again no huge surprises. Much of the next block of text is based on my assumptions, and if anyone would care to learn me the error of my ways that would be welcomed.
All the kids travel out of the area to school. Presumably the primary students go to Bungendore from the South of the area and to Queanbeyan in the North (as would those in the Catholic system). The non-Government Secondary students would go to the ACT, as there are no non-Government schools in Queanbeyan or Bungendore of which I am aware. (I assume any home-schooled kids would also be in other non-Government, but this may depend on how the child's education is recognised (or not) within the school system.)
Moving on to post-school education the split is between TAFE and University. All Universities which could realistically be physically attended by people resident in the Gazette area are in the ACT. It is also possible that some students may be taking a correspondence course through an institution in another State (or indeed Country) in which case the instructions on the form explain how this should be reported. The key age groups for people attending TAFE and Uni are 10-19 and 20-29.
 The younger age group is dominated by the 10-18 year-olds attending school and the older by the not applicable (= not attending) categories. It is interesting that most people go to Uni full time while most TAFE attendance is part time.
I next looked at the attendance rates for the Gazette area compared to NSW. For the 30+ groups the differences were small, especially considering the low proportions in the attending categories. However there were some interesting differences for the two younger classes. The next chart shows he differences in rates between the Gazette area and NSW with a negative value meaning that the proportion of people in the group was lower in the Gazette area than for NSW.
 For the 0-19 group the Gazette area has a much lower proportion of people not attending an institution. The most interesting are is the proportion of people attending full time. That is somewhat higher for the 0-19 age group but a lot lower in the Gazette area for the 20-29 age group: that was somewhat of a surprise to me (quoting Benny Hill "Learning all the time").
To try to get a handle on this I looked at the attendance rates for individual years of age within the age-group. I also included the age specific rates for Australia as a whole.
 Using the polynomial to smooth out the Gazette distribution it is apparent that the difference is similar for all single -years of age. The Australian and NSW lines almost lie on top of one another, suggesting that the difference is in the Gazette area data.
This led me to recall noticing in drafting a previous post (which I cannot not find to link to) that there was a large deficiency of people in the 20 -29 age group. Taking these two factors into account I suggest that a major reason the age group is under-represented is because people move away to study. So I have learnt something (through a rather more orthodox process than the late Mr Hill).
The preceding is dealing with current participation in the education process. A further aspect covered in the Census is people's past efforts: what level of education have they attained? This is where the Framework rears its concept-ridden head since it distinguishes a range of Certificate Levels which meant nothing to me. So I learnt by looking at the Framework website where the phrase "post-modern jargon" sprang prominently into my mind. (As did the simpler word "bullshit", but since I was able to deconstruct it to make sense of what they mean, I'll withdraw that.) Here is my summary:
Those seem to fit in between finishing school at Year 9 and going further at school. The other two classes rate above Year 10 or higher.in the Census list at least.
 It is notable how few of our applicable population do not have at least Year 10. I grouped the qualifications (excluding the not applicable and not stated categories) together into three bands as shown below. All the geographic groupings are broadly similar but the Gazette area has the highest proportion with at least a Bachelors Degree and the lowest proportion below Year 10.


I next looked at the attendance rates for the Gazette area compared to NSW. For the 30+ groups the differences were small, especially considering the low proportions in the attending categories. However there were some interesting differences for the two younger classes. The next chart shows he differences in rates between the Gazette area and NSW with a negative value meaning that the proportion of people in the group was lower in the Gazette area than for NSW.

To try to get a handle on this I looked at the attendance rates for individual years of age within the age-group. I also included the age specific rates for Australia as a whole.

This led me to recall noticing in drafting a previous post (which I cannot not find to link to) that there was a large deficiency of people in the 20 -29 age group. Taking these two factors into account I suggest that a major reason the age group is under-represented is because people move away to study. So I have learnt something (through a rather more orthodox process than the late Mr Hill).
The preceding is dealing with current participation in the education process. A further aspect covered in the Census is people's past efforts: what level of education have they attained? This is where the Framework rears its concept-ridden head since it distinguishes a range of Certificate Levels which meant nothing to me. So I learnt by looking at the Framework website where the phrase "post-modern jargon" sprang prominently into my mind. (As did the simpler word "bullshit", but since I was able to deconstruct it to make sense of what they mean, I'll withdraw that.) Here is my summary:
- Certificate 1: Basic knowledge for work, further knowledge and community involvement
- Certificate 2: Undertaking mainly routine work and as a pathway to further learning (this appear in the two higher grades as well)
Those seem to fit in between finishing school at Year 9 and going further at school. The other two classes rate above Year 10 or higher.in the Census list at least.
- Certificate 3: broad range of knowledge for skilled work
- Certificate 4: specialised knowledge for skilled work.
The first chart shows the distribution of the population of the Gazette according to educational attainment. (The not applicable category is for those aged under 15 years of age.)


Comments