Carwoola enters the ancestry fray!
I recently put up a post about the ancestry of folk in Queanbeyan, as revealed by the 2011 Census. This led me wonder what the situation was for Carwoola, and I have taken a look at the Census data for the area, in contrast with Queanbeyan. I have tried to make this post self contained but if the topic interests you a look at the former post might be worthwhile.
I have also tried to keep the technical stuff about definitions and concepts to a minimum but can't prevent myself from including a bit of it. I have coloured those buts in red, so they can be skipped without interfering with the story.
As a first technical point I am defining "Carwoola" to be as close as I can get (see red bit at foot of post) to the catchment area of the Stoney Creek Gazette thus covering the State Suburbs of Primrose Valley, Hoskinstown and the Carwoola elements of the City of Queanbeyan and Palerang Shire.
 A second technical issue is that the confidentiality processes used by ABS apply rounding to cells of 1 or 2: some get rounded up to 3 and others down to 0. Thus some cells shown as zero may actually have 1 or two people in them, and cells of 3 should be interpreted as "very few". This doesn't affect any rational analysis.
A first major point to emerge is that Carwoola (population 2,048) has representatives of 34 ancestral groups as opposed to 129 ancestral groups in Queanbeyan (population 37,994) . The population size has a major impact on the number of groups in the areas, and with less people in Carwoola there is reduced likelihood of very small ancestral groups (say less than 10 people in Queanbeyan) being represented. Trying to prove that would make for a very tedious stretch of red text, so just trust me, I'm a statistician.
The second main point to strike me when looking at the Table Builder output from the Census was that the Big 3 reported ancestries are, as with Queanbeyan, English, Australian and Irish. However they occupy a considerably higher proportion of total responses in Carwoola than in Queanbeyan (and I am ignoring the small duplication between the series due to some Carwoola people also being Queanbeyan folk: this ain't rocket science). Extending that slightly to include the top 5 reported ancestries (and a catch-all 'other' category) in Carwoola and the equivalent percentages in Queanbeyan gives these pie charts,
 The most obvious thing here is the larger orange slice for Queanbeyan, representing the 'other' ancestries. The combination of Blue, Maroon and Green is a bit smaller for Queanbeyan
In the above I referred to 'reported ancestries" since I have excluded the 'not stated' category which amounts to approximately 10% of households in Carwoola rather than 6% in Queanbeyan. I suspect, but can't prove, that much of the additional non-response is where a questionnaire was not submitted for the household and the higher rate reflects the presence of a number of 'weekenders' in Carwoola which meant the collector was unable to obtain a questionnaire from an apparently occupied dwelling.
The 2 most notable ancestral groups under-represented in Carwoola (when compared with Queanbeyan) are those in which the latter exceeds NSW as a whole: Macedonian and Italian.
People of Chinese and Indian ancestry are both about 1.2% of the Queanbeyan population, which is lower than for NSW as a whole - much lower in the case of Chinese ancestry. In Carwoola they are both even lower at about 0.2%, equivalent to 3 or 4 people.
I did contemplate whether the extra capital involved in buying acreage might dissuade them from moving out of the urban area. While information on wealth is not available I looked at the income distribution for Queanbeyan as a whole and the people of Chinese (457 people) and South Asian (834 people) ancestry in that city. Excluding those less than 15 years of age for whom the income question is not applicable, the situation is shown in the following chart.
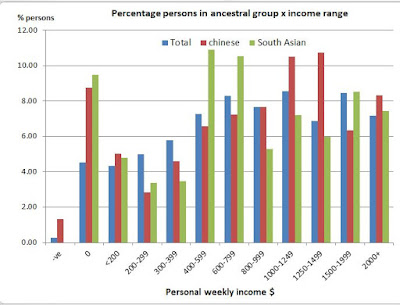 While there are clearly differences between the three series, they are not statistically significant and I conclude that economic factors don't explain the low numbers of people of these 2 ancestral groups in Carwoola. So, for these two groups - and possibly others - it appears that the rural acreage lifestyle just doesn't appeal for whatever reason.
There are a number of other ancestral groups represented in Queanbeyan but not in Carwoola but the numbers of people involved are lower and I am not game to try to draw out reasons.
I have also compared the Carwoola situation with an area in the Wild West of Palerang Shire comparing the State Suburbs of Burra, Royalla and Googong (with a total population of 2,724).
 The Western unit has slightly more ancestral groups represented : 37 vs 34. However, it also has a slightly higher proportion (73% vs 71%) of people classified to English, Australian and Irish. So I conclude the two areas are quite similar as regards to level of "multiculturality".
This analysis led me to look closely at the map of the state suburbs and found a major daftness. The Eastern boundary of the State Suburb of Burra is Burra Creek. This means that the locality of Urila is included in Primrose Valley rather than Burra. As there is no crossing at the Queanbeyan River, which forms the Eastern boundary of Urila and visible in the map highlighted with red dots, it means that it is not possible to get from one part of Primrose Valley to the other. This has been raised with ABS.
I have also tried to keep the technical stuff about definitions and concepts to a minimum but can't prevent myself from including a bit of it. I have coloured those buts in red, so they can be skipped without interfering with the story.
As a first technical point I am defining "Carwoola" to be as close as I can get (see red bit at foot of post) to the catchment area of the Stoney Creek Gazette thus covering the State Suburbs of Primrose Valley, Hoskinstown and the Carwoola elements of the City of Queanbeyan and Palerang Shire.

A first major point to emerge is that Carwoola (population 2,048) has representatives of 34 ancestral groups as opposed to 129 ancestral groups in Queanbeyan (population 37,994) . The population size has a major impact on the number of groups in the areas, and with less people in Carwoola there is reduced likelihood of very small ancestral groups (say less than 10 people in Queanbeyan) being represented. Trying to prove that would make for a very tedious stretch of red text, so just trust me, I'm a statistician.

In the above I referred to 'reported ancestries" since I have excluded the 'not stated' category which amounts to approximately 10% of households in Carwoola rather than 6% in Queanbeyan. I suspect, but can't prove, that much of the additional non-response is where a questionnaire was not submitted for the household and the higher rate reflects the presence of a number of 'weekenders' in Carwoola which meant the collector was unable to obtain a questionnaire from an apparently occupied dwelling.
The 2 most notable ancestral groups under-represented in Carwoola (when compared with Queanbeyan) are those in which the latter exceeds NSW as a whole: Macedonian and Italian.
People of Chinese and Indian ancestry are both about 1.2% of the Queanbeyan population, which is lower than for NSW as a whole - much lower in the case of Chinese ancestry. In Carwoola they are both even lower at about 0.2%, equivalent to 3 or 4 people.
I did contemplate whether the extra capital involved in buying acreage might dissuade them from moving out of the urban area. While information on wealth is not available I looked at the income distribution for Queanbeyan as a whole and the people of Chinese (457 people) and South Asian (834 people) ancestry in that city. Excluding those less than 15 years of age for whom the income question is not applicable, the situation is shown in the following chart.

There are a number of other ancestral groups represented in Queanbeyan but not in Carwoola but the numbers of people involved are lower and I am not game to try to draw out reasons.
I have also compared the Carwoola situation with an area in the Wild West of Palerang Shire comparing the State Suburbs of Burra, Royalla and Googong (with a total population of 2,724).

This analysis led me to look closely at the map of the state suburbs and found a major daftness. The Eastern boundary of the State Suburb of Burra is Burra Creek. This means that the locality of Urila is included in Primrose Valley rather than Burra. As there is no crossing at the Queanbeyan River, which forms the Eastern boundary of Urila and visible in the map highlighted with red dots, it means that it is not possible to get from one part of Primrose Valley to the other. This has been raised with ABS.


Comments